梅斯医学MedSci APP
医路相伴,成就大医


梅斯医学MedSci APP
医路相伴,成就大医
一、控制变量 Covariate
控制变量:这些会影响因变量的因素是研究者不愿意看到的,它们的存在会干扰研究者分析自变量对因变量的影响。控制变量又称为“额外变量”,是必须被想办法施加控制或采用统计方法排除干扰的因素。
如果感觉上面那段话太抽象,我下面说个具体的例子解释一下。就像昨天那出戏,我们想知道年轻人生活地点的差异会不会影响结婚年龄,但千人千面,漂亮的讨人喜欢,丑了自然在婚恋市场上行情堪忧。因此将长相列为控制变量,就是排除这各因素的影响,让我们能够聚焦于地点差异对结婚年龄的影响。
科学研究中,我们通常不可能保证控制变量全部相同,而是采取统计方法排除其对因变量的影响。然而在现实生活中,我们很难做到这种“统计排除”。所以,理解控制变量实际上就是让我们分析因果(自变量影响因变量)关系时,留意是否有需要控制的因素没有被控制,如果没有控制,那我们就有理由怀疑这种因果关系。
值得强调的是,并不是除了自变量外所有能影响因变量都是控制变量,中介变量和调节变量都能影响因变量。因此控制变量是一个相对的概念,主要看我们的研究目的或要弄清的问题。比如讲生活地点对结婚年龄的影响,就要控制长相因素,如果我们研究长相对结婚年龄的影响,那长相就是自变量了。
调节变量(moderator)和中介变量(mediator)是两个重要的统计概念,它们都与回归分析有关。相对于人们关注的自变量和因变量而言,调节变量和中介变量都是第三者,经常被人混淆。从文献上看,存在的问题主要有如下几种: (1)术语混用或换用,两个概念不加区分。例如,在描述同一个过程时,既使用调节过程的术语又使用中介过程的术语(2)术语和概念不一致。如研究的是调节过程,却使用中介的术语。(3)术语和统计分析不一致。如使用了中介变量的术语,却没有做相应的统计分析。出现前面的任何一个问题都会使统计结果解释含糊不清,往往导致错误结论。仅在儿童临床心理和少儿心理方面的研究文献中, Holmbeck就指出了不少误用的例子。
国内涉及中介变量的文章不多,涉及调节变量的就更少。从国外的情况看,一旦这方面的定量分析多起来,误用和混用的情况也就可能多起来,所以让应用工作者正确理解和区分中介变量和调节变量,会用适当的方法进行统计分析,对提高心理科学的研究水平具有积极意义。
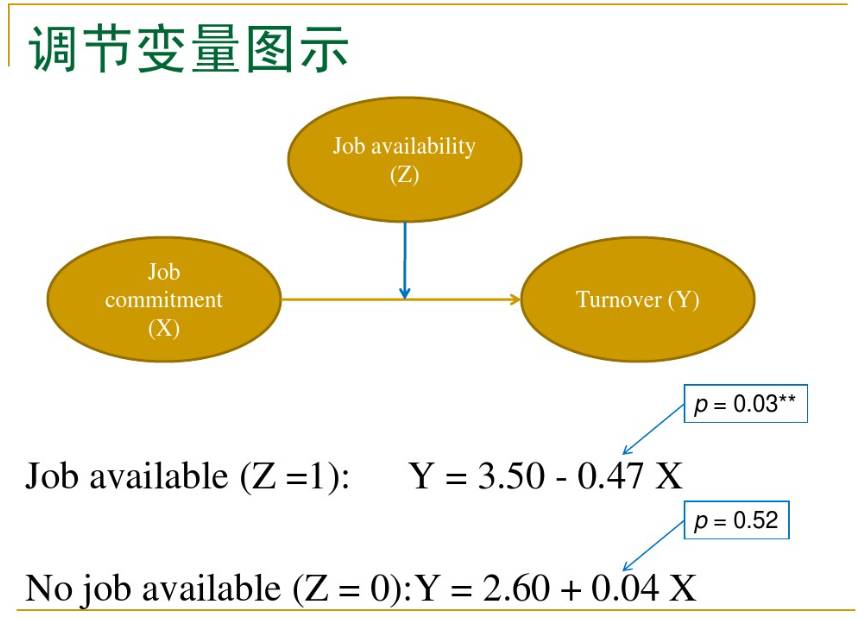
如果变量Y与变量X的关系是变量M 的函数,称M 为调节变量。就是说, Y与X 的关系受到第三个变量M 的影响。调节变量可以是定性的(如性别、种族、学校类型等) ,也可以是定量的(如年龄、受教育年限、刺激次数等) ,它影响因变量和自变量之间关系的方向(正或负)和强弱. 例如,学生的学习效果和指导方案的关系,往往受到学生个性的影响:一种指导方案对某类学生很有效,对另一类学生却没有效,从而学生个性是调节变量。又如,学生一般自我概念与某项自我概念(如外貌、体能等)的关系,受到学生对该项自我概念重视程度的影响:很重视外貌的人,长相不好会大大降低其一般自我概念;不重视外貌的人,长相不好对其一般自我概念影响不大,从而对该项自我概念的重视程度是调节变量。
在做调节效应分析时,通常要将自变量和调节变量做中心化变换(即变量减去其均值)。
最简单常用的调节模型,即假设Y与X 有如下关系
Y = aX + bM + cXM + e (1)
可以把上式重新写成
Y = bM + ( a + cM ) X + e
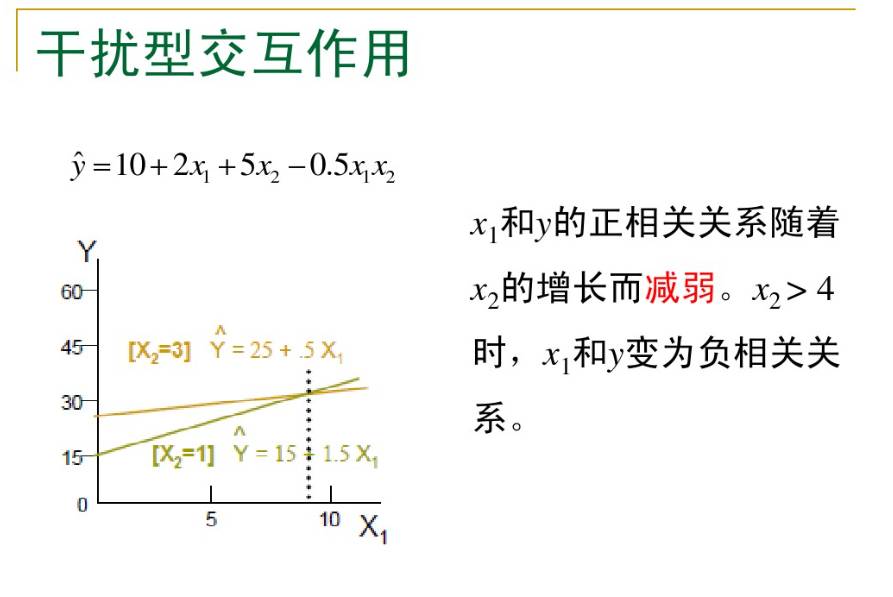
对于固定的M ,这是Y对X 的直线回归。Y与X 的关系由回归系数a + cM 来刻画,它是M 的线性函数, c衡量了调节效应(moderating effect)的大小。
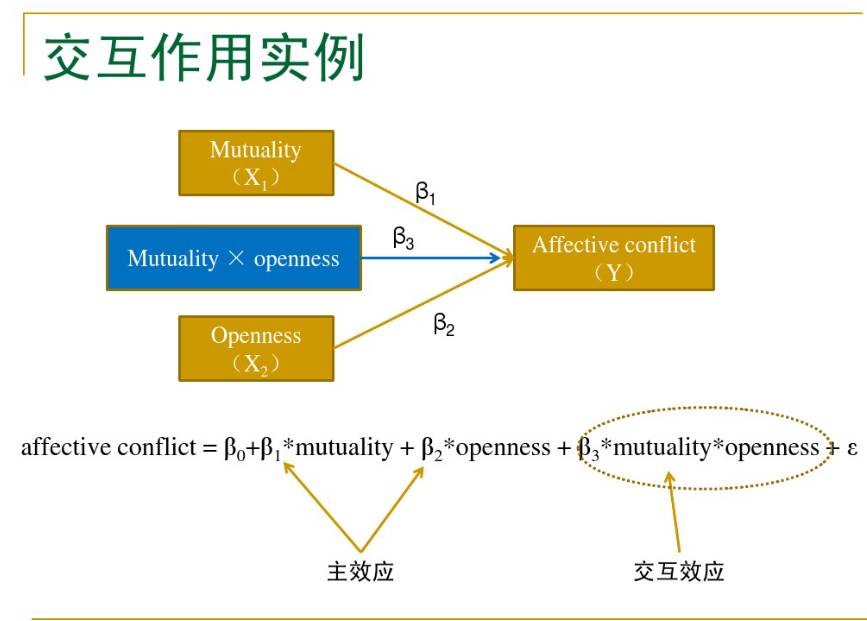
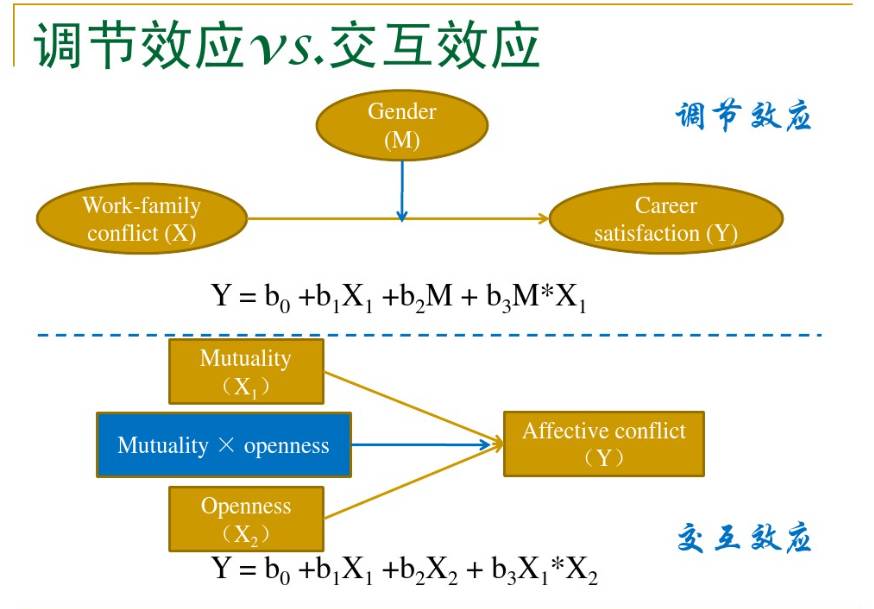
1、调节效应与交互效应
对模型中调节效应的分析主要是估计和检验c。如果c显著(即H0∶c = 0的假设被拒绝) ,说明M 的调节效应显著。熟悉交互效应( interaction effect)的读者可以从模型看出, c其实代表了X与M 的交互效应,所以这里的调节效应就是交互效应。这样,调节效应与交互效应从统计分析的角度看可以说是一样的
然而,调节效应和交互效应这两个概念不完全一样。在交互效应分析中,两个自变量的地位可以是对称的,其中任何一个都可以解释为调节变量;也可以是不对称的,只要其中有一个起到了调节变量的作用,交互效应就存在。这一点从有关讨论交互效应的专著中可以看出(例如,显变量之间的交互效应,潜变量之间的交互效应 。但在调节效应中,哪个是自变量,哪个是调节变量,是很明确的,在一个确定的模型中两者不能互换。例如,要研究数学能力的性别差异,将年级作为调节变量,这个问题关注的是性别差异,以及性别差异是否会随年级而变化。如果从小学一年级到高中三年级都获得了各年级学生有代表性的样本,每个年级各用一份测试题,所得的数据就可以进行上述分析。但同样的数据却不能用于做年级为自变量、数学能力为因变量、性别为调节变量的分析,因为各年级的测试题目不同,得分没有可比性,因而按调节效应的分析方法 ,分别不同性别做数学能力对年级的回归没有意义。要做数学能力对年级的回归,应当用同一份试题测试所有年级的学生。
2、调节效应分析方法
调节效应分析和交互效应分析大同小异。这里分两大类进行讨论。一类是所涉及的变量(因变量、自变量和调节变量)都是可以直接观测的显变量(observable variable) ,另一类是所涉及的变量中至少有一个是潜变量( latent variable) 。
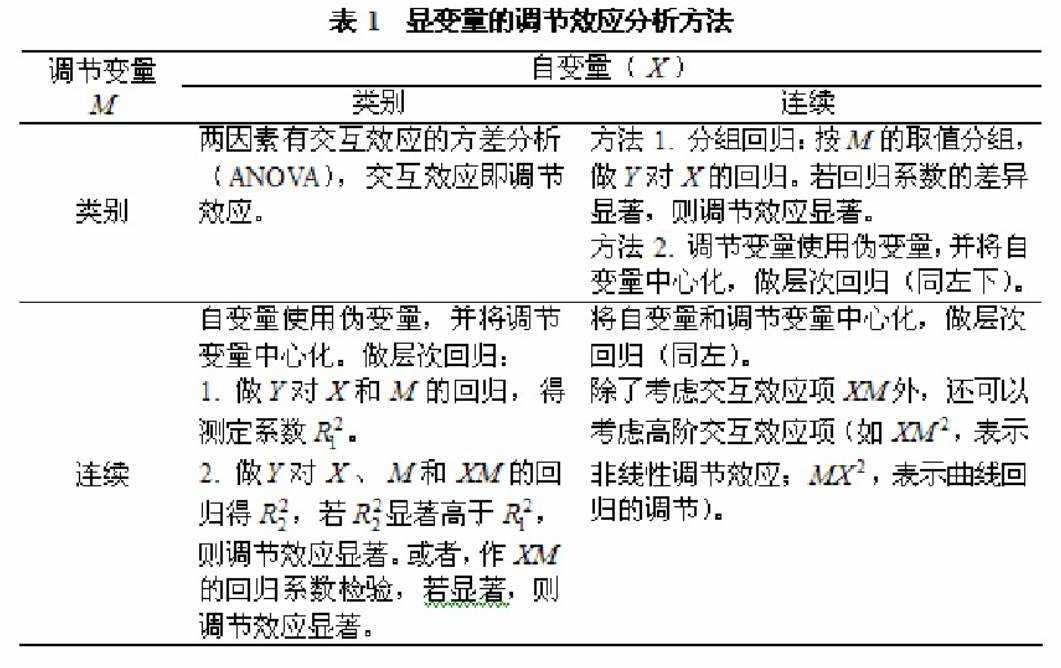
显变量的调节效应分析方法 调节效应分析方法根据自变量和调节变量的测量级别而定。变量可分为两类, 一类是类别变量( categoricalvariable) ,包括定类和定序变量,另一类是连续变量( continuous variable) ,包括定距和定比变量。定序变量的取值比较多且间隔比较均匀时,也可以近似作为连续变量处理。表1分类列出了显变量调节效应分析方法。
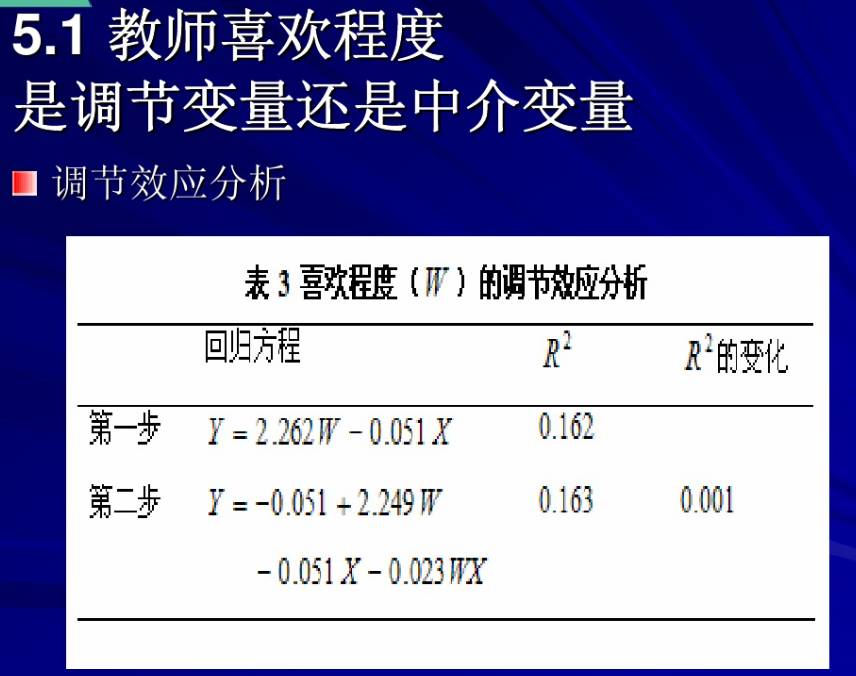
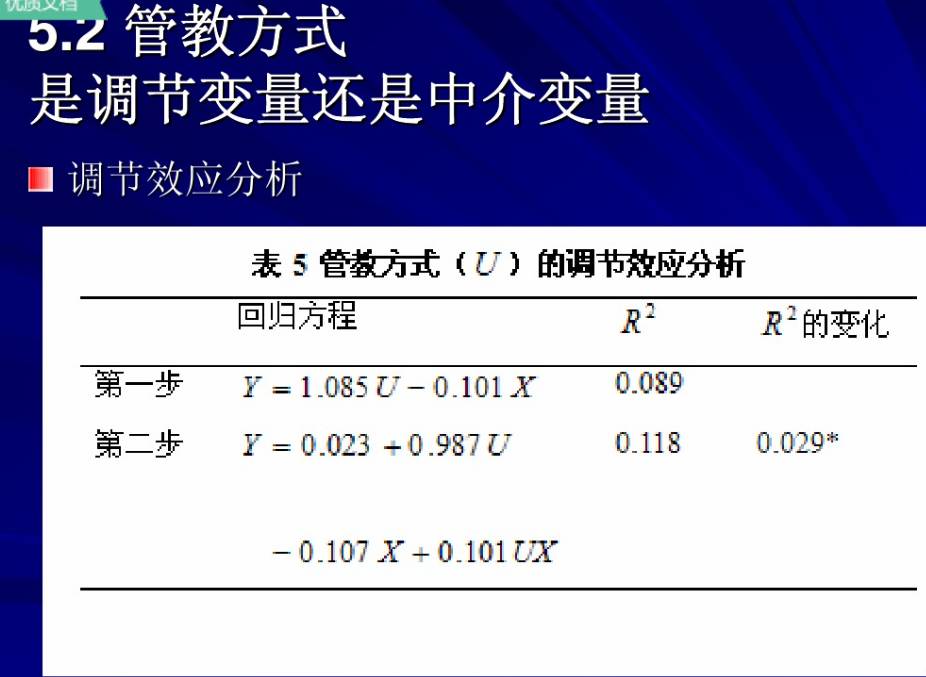
当自变量和调节变量都是类别变量时做方差分析。当自变量和调节变量都是连续变量时,用带有乘积项的回归模型,做层次回归分析: ( 1)做Y对X和M 的回归,得测定系数R21。( 2)做Y对X、M 和XM 的回归得R22 ,若R22 显著高于R21 ,则调节效应显著;或者,做XM 的偏回归系数检验,若显著,则调节效应显著。
当调节变量是类别变量、自变量是连续变量时,做分组回归分析。但当自变量是类别变量、调节变量是连续变量时,不能做分组回归,而是将自变量重新编码成为伪变量( dummy variable) ,用带有乘积项的回归模型,做层次回归分析。
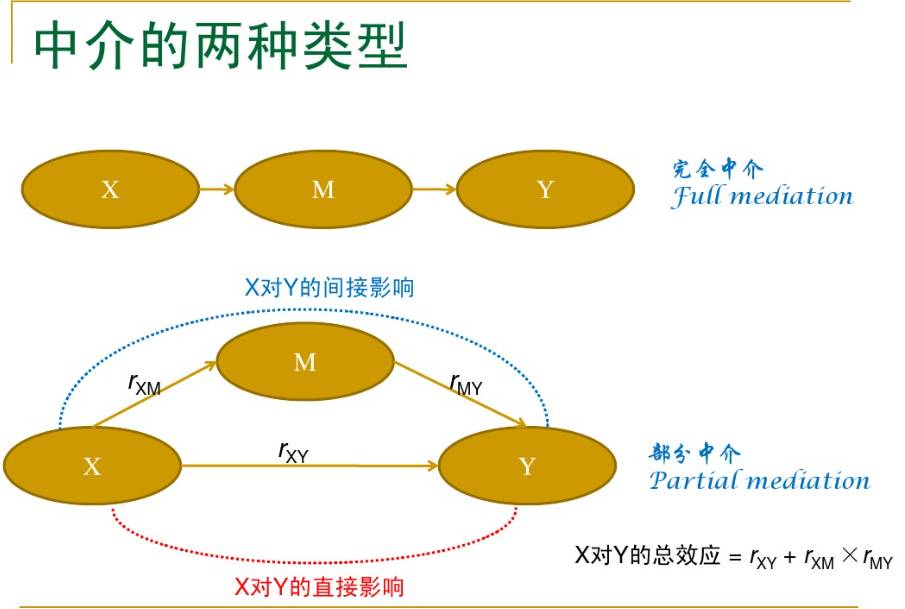
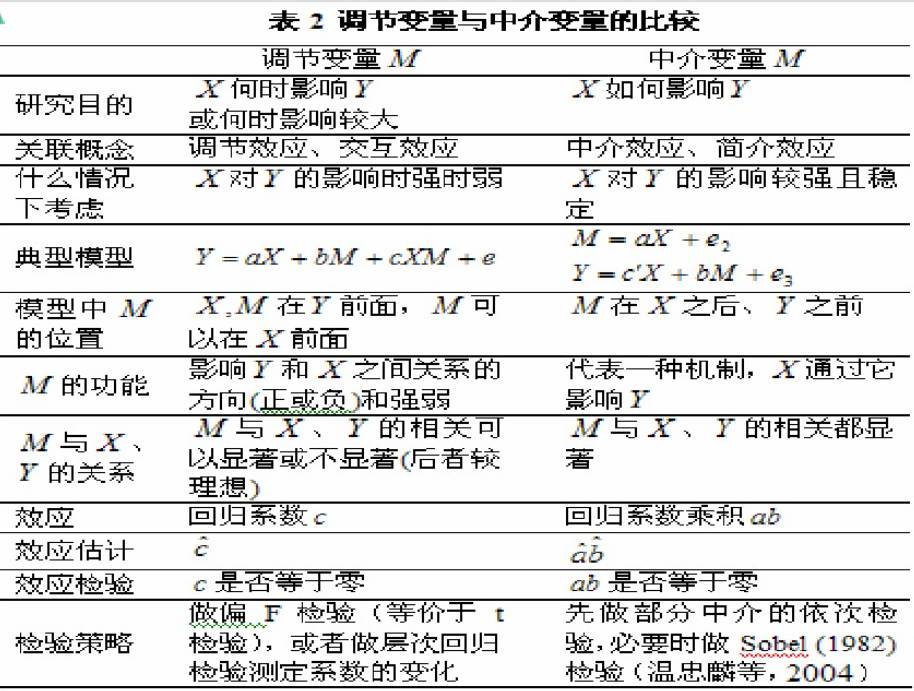
考虑自变量X 对因变量Y的影响,如果X 通过影响变量M 来影响Y,则称M 为中介变量。例如,上司的归因研究:下属的表现———上司对下属表现的归因———上司对下属表现的反应,其中的“上司对下属表现的归因”为中介变量 。
如果一个变量与自变量或因变量相关不大,它不可能成为中介变量,但有可能成为调节变量。理想的调节变量是与自变量和因变量的相关都不大。有的变量,如性别、年龄等,由于不受自变量的影响,自然不能成为中介变量,但许多时候都可以考虑为调节变量。对于给定的自变量和因变量,有的变量做调节变量和中介变量都是合适的,从理论上都可以做出合理的解释。
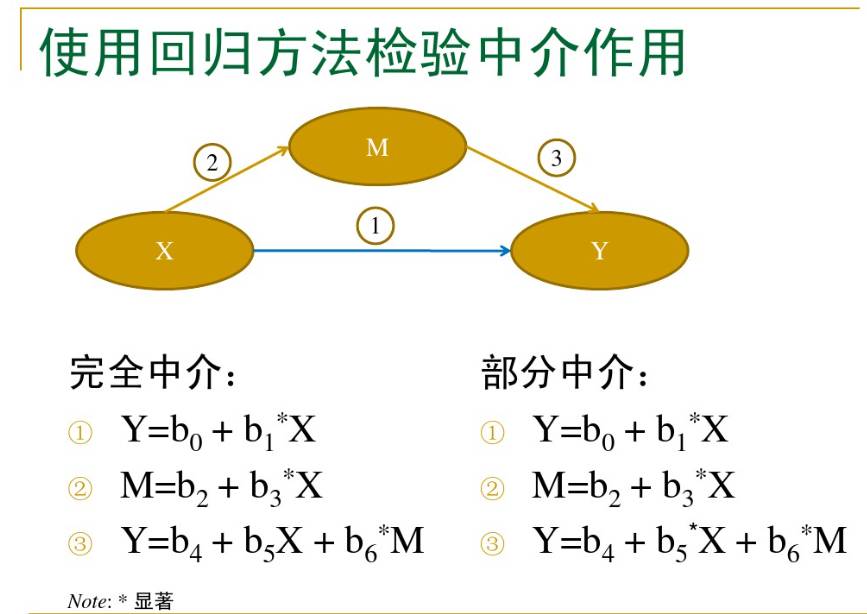
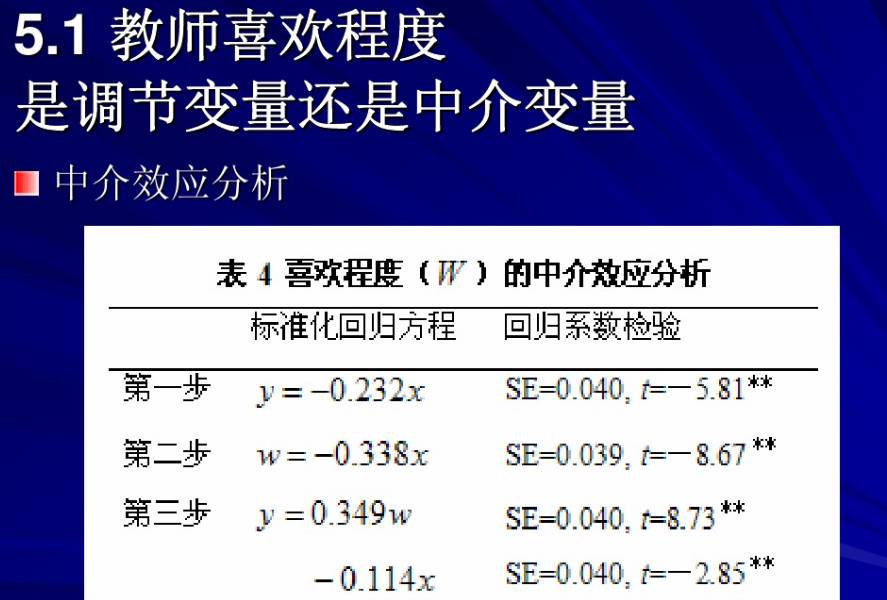
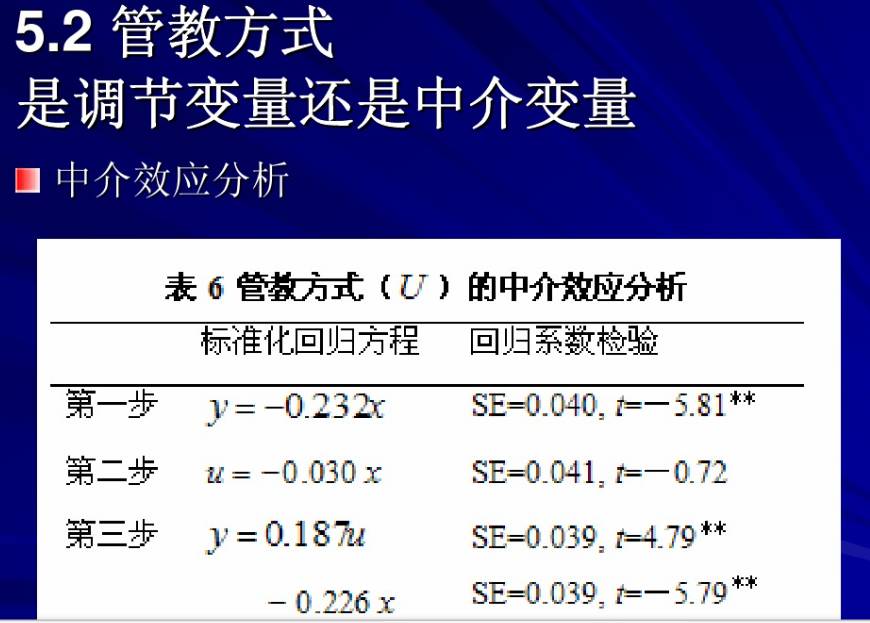
一般说来,简单的分析该变量是否是中介变量可以用线性回归,但要更严谨的话,就要采用结构方程(结构方程正在学习中,所以我一定要好好学,高人也只是告诉我如何用线性回归来分析数据来证明该变量是否是中介变量)一般分为三步,首先是分别检验每一个变量(包括自变量和第三变量)的主效应是否显著;第二步是将自变量放入回归方程中,检验自变量的效应;第三步,将第三变量也移入回归方程中,检验自变量的效应,若自变量的效应与之前相比大大减少甚至变为零,那么该变量的确就起到了中介的作用。值得注意的一点就是,变量的中介作用必须建立在理论和现实的基础上,正如前所述,自变量必须在现实或理论上可以影响第三变量的变化,否则,即使数据支持该变量有中介效应,该结果也是无效的。
1、Mediator versus Moderator variables 中介变量与调节变量的区别(英文解释)
The classic reference on this topic is Baron, R. M., & Kenny, D. A. (1986). The moderator-mediator variable distinction in social psychological research: Conceptual, strategic, and statistical considerations. Journal of Personality and Social Psychology, 51, 1173-1182.
Most of what is written here comes directly from this classic paper.
· Moderator variables - "In general terms, a moderator is a qualitative (e.g., sex, race, class) or quantitative (e.g., level of reward) variable that affects the direction and/or strength of the relation between an independent or predictor variable and a dependent or criterion variable. Specifically within a correlational analysis framework, a moderator is a third variable that affects the zero-order correlation between two other variables. ... In the more familiar analysis of variance (ANOVA) terms, a basic moderator effect can be represented as an interaction between a focal independent variable and a factor that specifies the appropriate conditions for its operation." p. 1174
· Mediator variables - "In general, a given variable may be said to function as a mediator to the extent that it accounts for the relation between the predictor and the criterion. Mediators explain how external physical events take on internal psychological significance. Whereas moderator variables specify when certain effects will hold, mediators speak to how or why such effects occur." p. 1176

The general test for mediation is to examine the relation between the predictor and the criterion variables, the relation between the predictor and the mediator variables, and the relation between the mediator and criterion variables. All of these correlations should be significant. The relation between predictor and criterion should be reduced (to zero in the case of total mediation) after controlling the relation between the mediator and criterion variables.
Another way to think about this issue is that a moderator variable is one that influences the strength of a relationship between two other variables, and a mediator variable is one that explains the relationship between the two other variables. As an example, let's consider the relation between social class (SES) and frequency of breast self-exams (BSE). Age might be a moderator variable, in that the relation between SES and BSE could be stronger for older women and less strong or nonexistent for younger women. Education might be a mediator variable in that it explains why there is a relation between SES and BSE. When you remove the effect of education, the relation between SES and BSE disappears.
Understanding moderation is one of those topics in statistics that is so much harder than it needs to be.
Here are three suggestions to make it just a little easier.
I have spoken with a number of researchers who are surprised to learn that moderation is just another term for interaction.
Perhaps it’s because moderation often appears with discussions of mediation. Or because we tend to think of interaction as being part of ANOVA, but not regression.
In any case, both an interaction and moderation mean the same thing: the effect of one predictor on a response variable is different at different values of the second predictor.
When we speak of moderation, we usually call the first predictor an independent variable, and the second the moderator. In other words, we’re really just interested in the effect of the independent variable on the dependent variable, and this effect is different at different values of the moderator. We’re never interested in the effect of the moderator on the dependent variable.
When we speak of interaction, we don’t usually distinguish between independent variable and the moderator. Either predictor could be considered to “moderate” the effect of the other.
Mathematically, there is no distinction. You don’t have to interpret one variable as the independent variable and the other as the moderator. But it can help interpretation to think of them that way.
Moderation effects are difficult to interpret without a graph. It helps to see what is the effect of the independent value at different values of the moderator.
If the independent variable is categorical, we measure its effect through mean differences, and those differences are easiest to see with plots of the means.
Moderation says that those mean differences are not the same at every value of the moderator. It can be hard to discern a pattern in how they differ without seeing it.
For example, the mean difference may get larger as the moderator increases. Or it may flip signs.
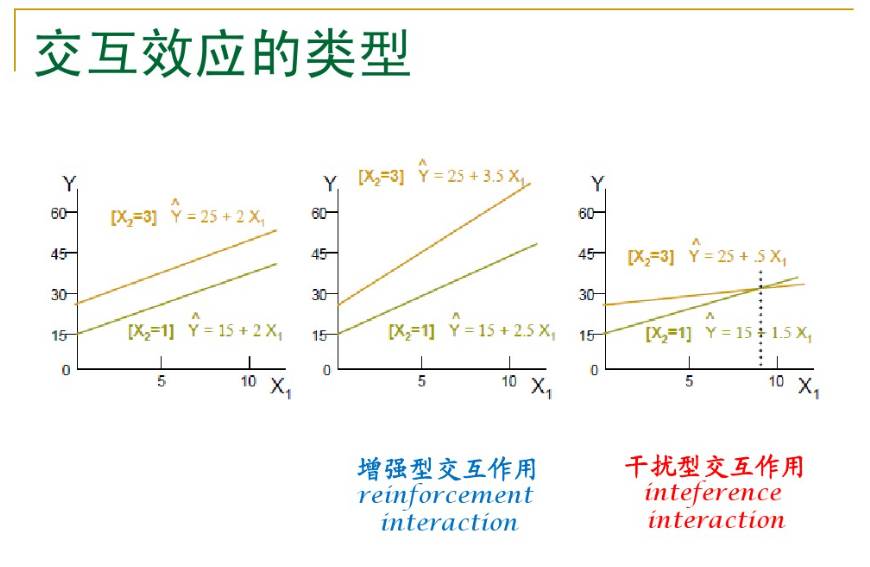
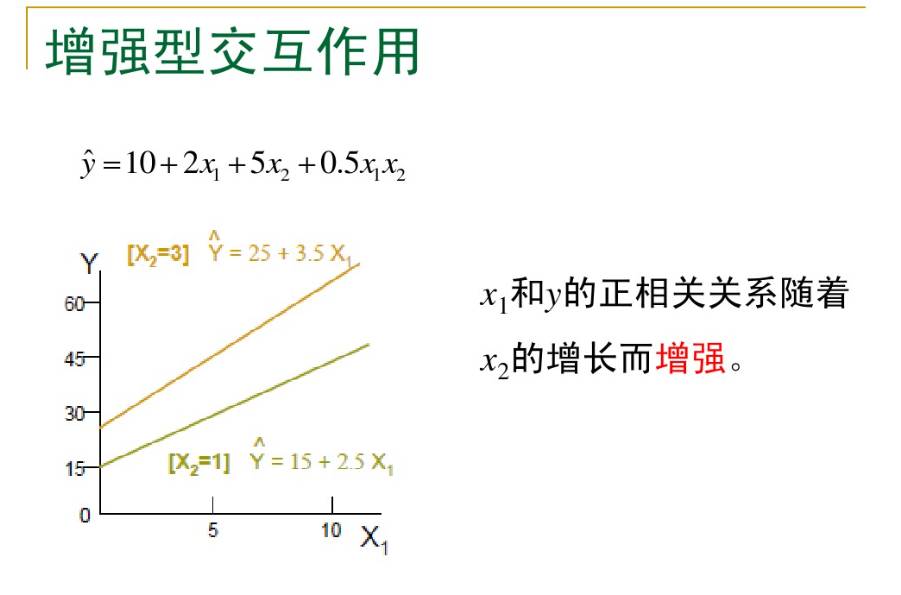
If the independent variable is continuous, we measure its effect through a slope of the regression line. So you want to plot the predicted values of those regression lines. Moderation says that the slope of the regression line is different at every value of the moderator. (Yes, that one regression equation really represents many different lines—one for every possible value of the moderator).
Once again, a positive slope may get larger (or smaller) as the moderator increases. Or it too can flip signs, going from a positive slope at low values of the moderator to a negative slope at high values.
But this is difficult to see without a graph.
If the moderator itself is continuous, you could potentially choose an infinite number of values at which to plot the effect of the independent variable. Not only would that take a while, the graph would be such a mess, you couldn’t see any patterns.
Luckily, plotting the effects of the independent variable at only a few values of the moderator are usually needed to see patterns.
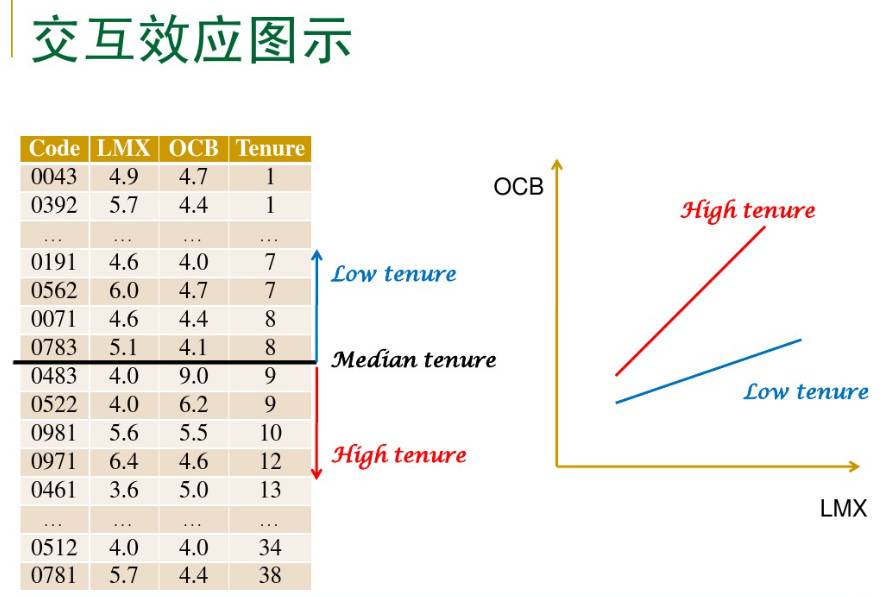
There are conventions to help you choose the best values of the moderator for plotting predicted values. But these conventions don’t always work in every situation.
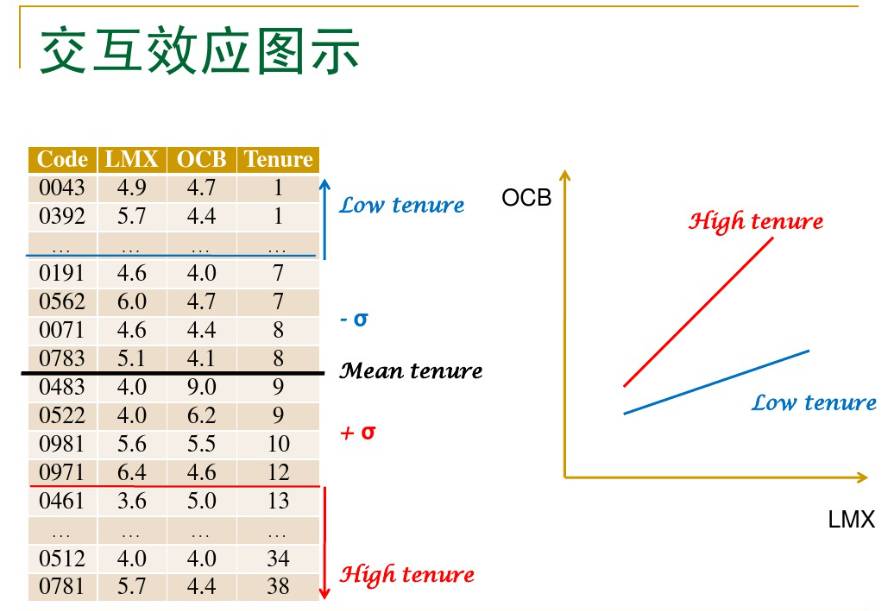
For example, one convention suggested by Cohen and Cohen and popularized by Aiken and West is to use three values of the moderator: the mean, the value one standard deviation above, and the value one standard deviation below the mean.
Most of the time, this is a great convention and it works very well.
One situation where it doesn’t is if the moderator is positively skewed. The value one standard deviation below the mean can be beyond the range of the data. In that case, using the minimum or some other small value of the moderator may be a better choice.
Likewise, sometimes very specific values of the moderator are particularly meaningful. For example, in years of education, values of 12 and 16 generally indicate high school and college graduation.
If years of education was the moderator, plotting effects of the independent variable when education equaled 12 makes a lot of sense, even if the mean is 12.57.
It’s not that using 12.57 is wrong. But spending a little time thinking about a more appropriate value can make interpretation, and therefore communication to your audience, easier.
参考资料:
https://www.scribbr.com/methodology/mediator-vs-moderator/
控制、调节和中介变量,系说,计量经济圈